


Page 192 - New Medley 5 Semester 2
P. 192
Interpretation of Graphs


               We  observe  different  informations in  a  graph.  We  interpret  a  graph  and


               find the answer of different related questions.
               Let us see some illustrated examples:

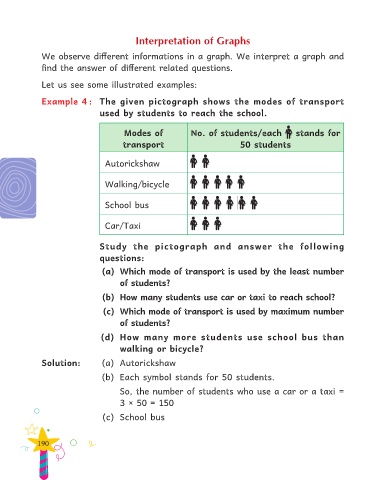
               Example 4 :  The  given  pictograph  shows  the  modes  of  transport

                                   used by students to reach the school.


                                            Modes of               No. of students/each   stands for
                                           transport                                50 students


                                     Autorickshaw


                                     Walking/bicycle


                                     School bus


                                     Car/Taxi


                                   Study  the  pictograph  and  answer  the  following

                                   questions:

                                    (a)  Which mode of transport is used by the least number
                                          of students?

                                    (b)  How many students use car or taxi to reach school?

                                     (c)  Which mode of transport is used by maximum number

                                          of students?

                                    (d)  How  many  more  students  use  school  bus  than
                                          walking or bicycle?


               Solution:            (a) Autorickshaw

                                    (b)  Each symbol stands for 50 students.

                                          So, the number of students who use a car or a taxi =
                                          3 × 50 = 150

                                    (c)  School bus


              190

