


Page 190 - New Medley 5 Semester 2
P. 190
Circle Graph or Pie Chart


               In  this  representation,  data  are  displayed  through  different  sectors  in  a


               circle.  Sectors  are  constructed  by  finding  the  central  angle  for  a  certain
               head. We can calculate the central angle using this formula:

                                                          Value of a certain head
                                Central angle =                                              × 360   °
                                                        Sum of values of all heads


               Example 3 :  Anuj recorded the times spending in different activities
                                   during a day as shown below:


                                      Activities        Sleeping         Studying         Playing          Others


                                    Time (in h)          8 hours        10 hours          2 hours         4 hours


                                   Display this information through a pie chart.

               Solution:           First, we calculate the measures of central angles for

                                   different activities.


                                         Activities             Time (in h)                 Central angle

                                                                                           8
                                      Sleeping                      8                          × 360° = 120°
                                                                                          24

                                                                                          10
                                      Studying                    10                           × 360° = 150°
                                                                                          24

                                                                                            2
                                      Playing                       2                           × 360° = 30°
                                                                                           24
                                                                                            4
                                      Others                        4                           × 360° = 60°
                                                                                           24


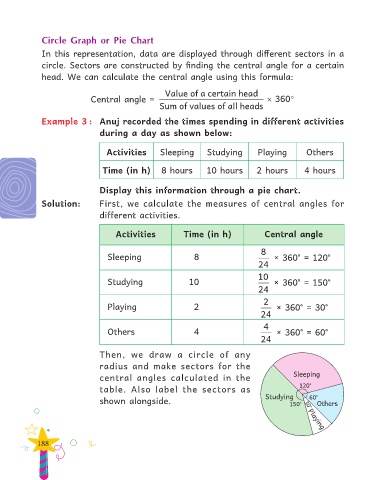
                                   Then, we draw a circle of any
                                   radius  and  make  sectors  for  the
                                                                                                      Sleeping
                                   central  angles  calculated  in  the
                                                                                                        120°
                                   table.  Also  label  the  sectors  as
                                                                                             Studying       60°
                                   shown alongside.
                                                                                                     150°  30°  Others


                                                                                                           Playing
              188

