


Page 195 - New Medley 5 Semester 2
P. 195
Observe the graph and answer the following questions:
              1.  Which language is opted by the least number of students?

              2.  How many more students opted for Telugu than Hindi?

              3.  How many students opted for German?
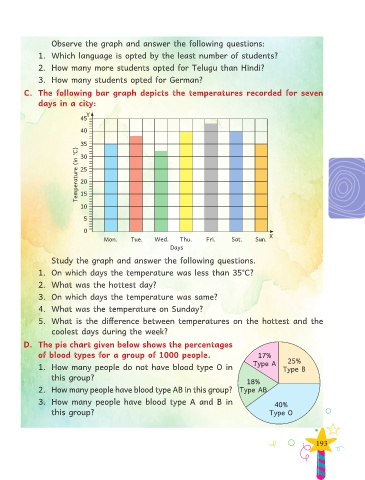
         C.  The  following  bar  graph  depicts  the  temperatures  recorded  for  seven

              days in a city:
                               Y
                             45

                             40

                             35
                            Temperature (in °C)  25
                             30


                             20
                             15

                             10

                              5
                              0
                                                                                              X
                                     Mon.     Tue.    Wed.     Thu.     Fri.     Sat.    Sun.
                                                            Days

                   Study the graph and answer the following questions.
              1.  On which days the temperature was less than 35°C?

              2.  What was the hottest day?
              3.  On which days the temperature was same?

              4.  What was the temperature on Sunday?

              5.  What  is  the  difference  between  temperatures  on  the  hottest  and  the

                   coolest days during the week?

         D.  The pie chart given below shows the percentages
              of blood types for a group of 1000 people.                                  17%
                                                                                        Type A      25%
              1.  How  many people do  not have  blood  type O  in                                 Type B
                   this group?
                                                                                      18%
              2.  How many people have blood type AB in this group? Type AB

              3.  How  many  people  have  blood  type  A and  B in                             40%
                   this group?                                                                Type O


                                                                                                              193

