


Page 197 - New Medley 5 Semester 2
P. 197
Worksheet–9


            1.  The table given below shows the number of students in each class of a
                primary school.                                                        • Productivity and Accountability


                          Classes                    I           II          III          IV           V

                  Number of Students               100          90           60           60           50


                (a)  Draw a bar chart to represent the above data.

                (b)  Draw a pie-chart to represent the above data.

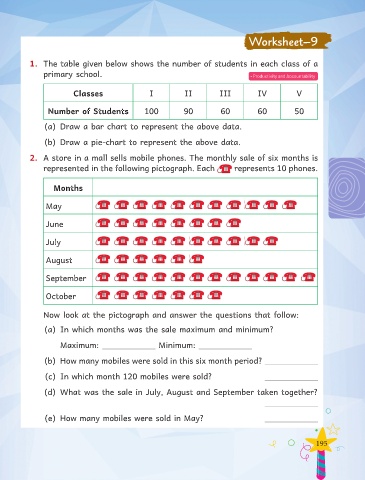
            2.  A store in a mall sells mobile phones. The monthly sale of six months is

                represented in the following pictograph. Each                     represents 10 phones.


                    Months


                 May


                 June


                 July


                 August

                 September


                 October


                Now look at the pictograph and answer the questions that follow:

                (a)  In which months was the sale maximum and minimum?


                      Maximum:                          Minimum:

                (b)  How many mobiles were sold in this six month period?


                 (c)  In which month 120 mobiles were sold?

                (d)  What was the sale in July, August and September taken together?


                 (e)  How many mobiles were sold in May?


                                                                                                              195

