


Page 188 - New Medley 5 Semester 2
P. 188
Presentation of Data
We collect information regarding age, weight, height, shoe size of students,
academic qualification, economic status, number of family members, choices,
etc. of people and first arrange them in rows and columns or in a table.
Further, we display them through any suitable graph like pictograph, bar
graph, pie chart or circle graph, etc., which gives the details at a glance.
Pictograph or Pictogram
Example 1: The table given below shows the number of students of
primary wings in a school.
Classes I II III IV V
No. of students 70 50 75 60 40
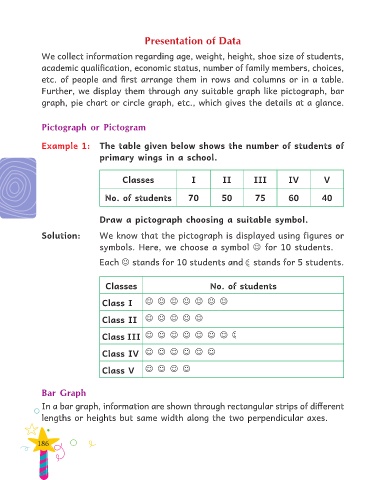
Draw a pictograph choosing a suitable symbol.
Solution: We know that the pictograph is displayed using figures or
symbols. Here, we choose a symbol for 10 students.
Each stands for 10 students and stands for 5 students.
Classes No. of students
Class I
Class II
Class III
Class IV
Class V
Bar Graph
In a bar graph, information are shown through rectangular strips of different
lengths or heights but same width along the two perpendicular axes.
186

