


Page 189 - New Medley 5 Semester 2
P. 189
Example 2 :  In  a  games  period,  sports  teacher  asks  the  students
                            of Class V about their choices of games. He records as

                            follow:

                                   Games              Cricket        Football      Badminton Table tennis

                             No. of students             10              6              12              8


                            Display this information through a bar graph.

        Solution:           We can draw a bar graph following these steps:

                            1.  Take  a  square grid paper  or  graph  paper. Mark  two

                                 perpendicular axes say OX and OY.

                            2.  Choose a suitable scale according to the given data.
                                 Here,  we  choose  1  block  for  2  students  on  vertical

                                 axis, i.e., OY.

                            3.  Then, write the name of games on OX-axis leaving equal
                                 gap between two names.


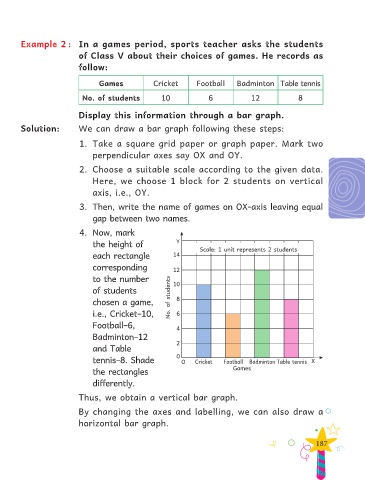
                            4.  Now, mark
                                 the height of                Y
                                                                      Scale: 1 unit represents 2 students
                                 each rectangle              14

                                 corresponding               12

                                 to the number               10
                                 of students
                                 chosen a game,             No. of students  8

                                 i.e., Cricket–10,            6

                                 Football–6,
                                                              4
                                 Badminton–12
                                                              2
                                 and Table
                                                              0
                                 tennis–8. Shade                  O  Cricket   Football  Badminton Table tennis X
                                                                                 Games
                                 the rectangles
                                 differently.

                              Thus, we obtain a vertical bar graph.

                              By  changing  the  axes  and  labelling,  we  can  also  draw  a

                            horizontal bar graph.

                                                                                                              187

