


Page 144 - New Medley 3 Semester 2
P. 144
1. Which subject is chosen by most of the students?
2. How many students chose English?
3. Which subject is chosen by the least number of students?
4. If 6 students were absent on that day, find the total
number of students in the class.
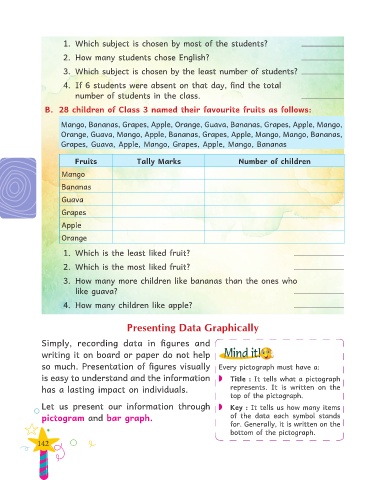
B. 28 children of Class 3 named their favourite fruits as follows:
Mango, Bananas, Grapes, Apple, Orange, Guava, Bananas, Grapes, Apple, Mango,
Orange, Guava, Mango, Apple, Bananas, Grapes, Apple, Mango, Mango, Bananas,
Grapes, Guava, Apple, Mango, Grapes, Apple, Mango, Bananas
Fruits Tally Marks Number of children
Mango
Bananas
Guava
Grapes
Apple
Orange
1. Which is the least liked fruit?
2. Which is the most liked fruit?
3. How many more children like bananas than the ones who
like guava?
4. How many children like apple?
Presenting Data Graphically
Simply, recording data in figures and
writing it on board or paper do not help Mind it!
so much. Presentation of figures visually Every pictograph must have a:
is easy to understand and the information Title : It tells what a pictograph
has a lasting impact on individuals. represents. It is written on the
top of the pictograph.
Let us present our information through Key : It tells us how many items
pictogram and bar graph. of the data each symbol stands
for. Generally, it is written on the
bottom of the pictograph.
142

