


Page 146 - New Medley 3 Semester 2
P. 146
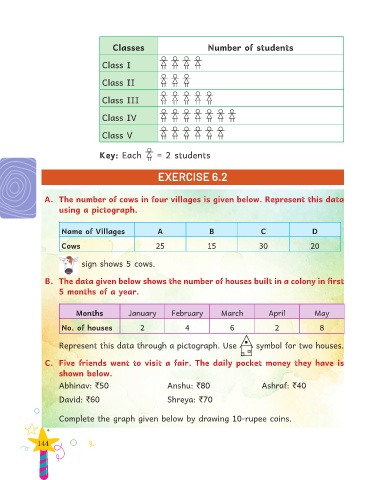
Classes                          Number of students

                                    Class I


                                    Class II


                                    Class III


                                    Class IV

                                    Class V


                                   Key: Each           = 2 students


                                                        EXERCISE 6.2


                A.  The number of cows in four villages is given below. Represent this data

                     using a pictograph.


                      Name of Villages                 A                 B                 C                 D

                      Cows                             25                15               30                20


                             sign shows 5 cows.


                B.  The data given below shows the number of houses built in a colony in first
                     5 months of a year.


                           Months            January        February         March            April           May

                      No. of houses              2               4              6               2              8


                     Represent this data through a pictograph. Use                       symbol for two houses.


                C.  Five  friends  went to visit  a fair.  The  daily  pocket money they have is
                     shown below.
                     Abhinav: `50                          Anshu: `80                      Ashraf: `40


                      David: `60                           Shreya: `70


                     Complete the graph given below by drawing 10-rupee coins.


              144

