


Page 147 - New Medley 3 Semester 2
P. 147
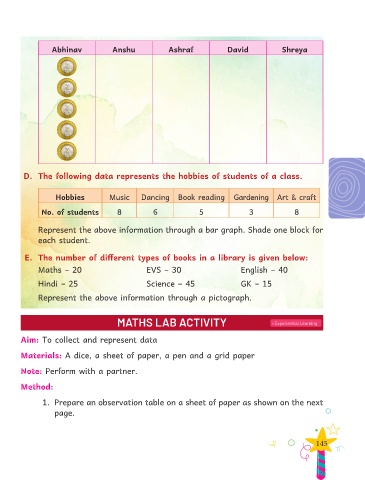
Abhinav              Anshu              Ashraf               David             Shreya


         D.  The following data represents the hobbies of students of a class.


                    Hobbies            Music      Dancing      Book reading       Gardening      Art & craft

               No. of students            8           6               5                3               8


              Represent the above information through a bar graph. Shade one block for
              each student.


          E.  The number of different types of books in a library is given below:

                Maths – 20                          EVS – 30                        English – 40

                Hindi – 25                          Science – 45                    GK – 15

                Represent the above information through a pictograph.


                                         MATHS LAB ACTIVITY                                    • Experiential Learning


        Aim: To collect and represent data

        Materials: A dice, a sheet of paper, a pen and a grid paper

        Note: Perform with a partner.


        Method:

                1.  Prepare an observation table on a sheet of paper as shown on the next
                    page.


                                                                                                              145

