


Page 183 - New Medley 4 Semester 2 PDF (Merged)
P. 183
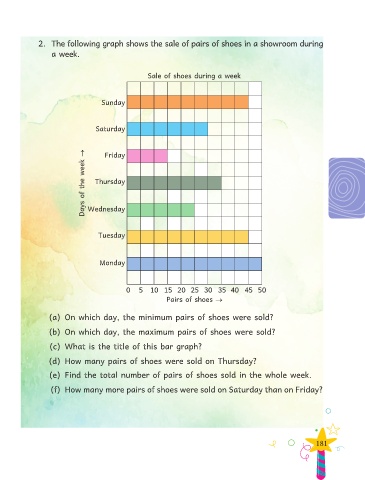
2.  The following graph shows the sale of pairs of shoes in a showroom during
                   a week.


                                                    Sale of shoes during a week


                                    Sunday


                                  Saturday


                              Days of the week →  Wednesday
                                     Friday


                                  Thursday


                                   Tuesday


                                   Monday


                                            0  5  10  15  20  25  30  35  40  45  50
                                                          Pairs of shoes →


                  (a)  On which day, the minimum pairs of shoes were sold?

                  (b)  On which day, the maximum pairs of shoes were sold?

                  (c)  What is the title of this bar graph?

                  (d)  How many pairs of shoes were sold on Thursday?

                  (e)  Find the total number of pairs of shoes sold in the whole week.

                   (f)  How many more pairs of shoes were sold on Saturday than on Friday?


                                                                                                              181

