


Page 178 - New Medley 4 Semester 2 PDF (Merged)
P. 178
7        Data Handling                                                                Competencies

                                                                                                          C-3.2


               We have learnt about data in our earlier classes. Now we will learn more

               about it. Before we go ahead let us observe the following.


                   Let us Recall

                                                                                         21st CENTURY SKILLS  • Initiative and Self-direction


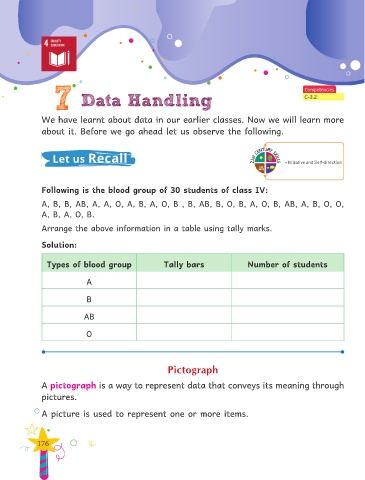
               Following is the blood group of 30 students of class IV:

               A, B,  B, AB, A, A, O, A, B, A, O, B , B, AB, B, O, B, A, O, B, AB, A, B, O,  O,

               A, B, A, O, B.

               Arrange the above information in a table using tally marks.

               Solution:


                 Types of blood group                     Tally bars                   Number of students


                               A


                               B


                              AB

                               O


                                                           Pictograph


               A pictograph is a way to represent data that conveys its meaning through

               pictures.


               A picture is used to represent one or more items.


              176

