


Page 180 - New Medley 4 Semester 2 PDF (Merged)
P. 180
Bar Graph


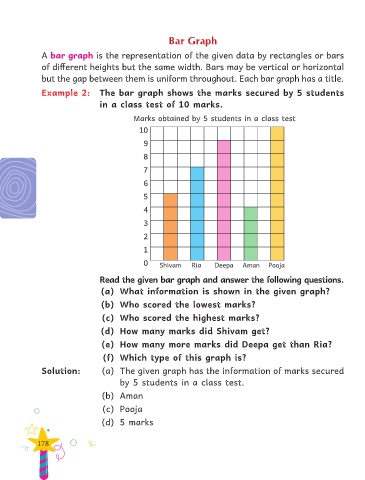
               A bar graph is the representation of the given data by rectangles or bars

               of different heights but the same width. Bars may be vertical or horizontal
               but the gap between them is uniform throughout. Each bar graph has a title.

               Example 2:  The bar graph shows the marks secured by 5 students

                                   in a class test of 10 marks.

                                               Marks obtained by 5 students in a class test

                                                 10
                                                   9

                                                   8

                                                   7

                                                   6

                                                   5

                                                   4

                                                   3
                                                   2

                                                   1

                                                   0
                                                        Shivam     Ria     Deepa     Aman     Pooja

                                   Read the given bar graph and answer the following questions.
                                    (a)  What information is shown in the given graph?

                                    (b)  Who scored the lowest marks?

                                    (c)  Who scored the highest marks?

                                    (d)  How many marks did Shivam get?

                                    (e)  How many more marks did Deepa get than Ria?
                                     (f)  Which type of this graph is?

               Solution:            (a)  The given graph has the information of marks secured

                                          by 5 students in a class test.

                                    (b)  Aman

                                    (c)  Pooja
                                    (d)  5 marks


              178

