


Page 186 - New Medley 4 Semester 2 PDF (Merged)
P. 186
Worksheet–7                                                                   • Productivity and Accountability


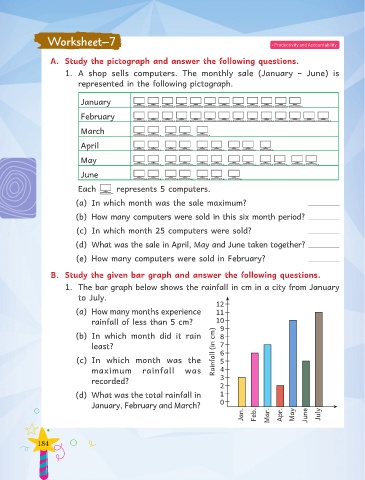
                  A.  Study the pictograph and answer the following questions.
                        1.  A shop sells computers.  The monthly sale (January – June) is

                            represented in the following pictograph.

                             January

                             February


                             March

                             April

                             May

                             June

                            Each         represents 5 computers.

                           (a)  In which month was the sale maximum?

                           (b)  How many computers were sold in this six month period?

                           (c)  In which month 25 computers were sold?

                           (d)  What was the sale in April, May and June taken together?

                           (e)  How many computers were sold in February?


                  B.  Study the given bar graph and answer the following questions.
                        1.  The bar graph below shows the rainfall in cm in a city from January

                            to July.
                                                                            12
                           (a)  How many months experience                  11
                                 rainfall of less than 5 cm?                10
                                                                           Rainfall (in cm)  6
                           (b)  In  which  month  did  it  rain              9
                                                                             8
                                 least?                                      7

                           (c)  In  which  month  was  the                   5
                                 maximum rainfall was                        4

                                 recorded?                                   3
                                                                             2
                           (d)  What was the total rainfall in               1
                                                                             0
                                 January, February and March?
                                                                                     Jan.  Feb.  Mar.  Apr.  May  June  July


              184

